All information acquired so far is for the most part not qualitative but descriptive. They help in the development of the city and its castle (general appearance of buildings, description of the materials, ...) but are not of great help in terms of dimensioning. Paths, forests, city and villages are described on the map of Arenberg but the more precise topology is needed to create a realistic 3-dimensional view of the whole.
The land has a special configuration and the location of the castle is not a coincidence. The satellite images available to the general public illustrate this point. Several international organizations provide these satellite images as 'raster' files (image supplemented by altitude information at each point).
Copernicus is a European system for monitoring the Earth. The data is collected by different sources, including observation satellites. The data is processed and provides reliable and up-to-date information in six thematic areas: land, sea, atmosphere, climate change, emergency management and security. These files are in the following form (Fig. 11) :
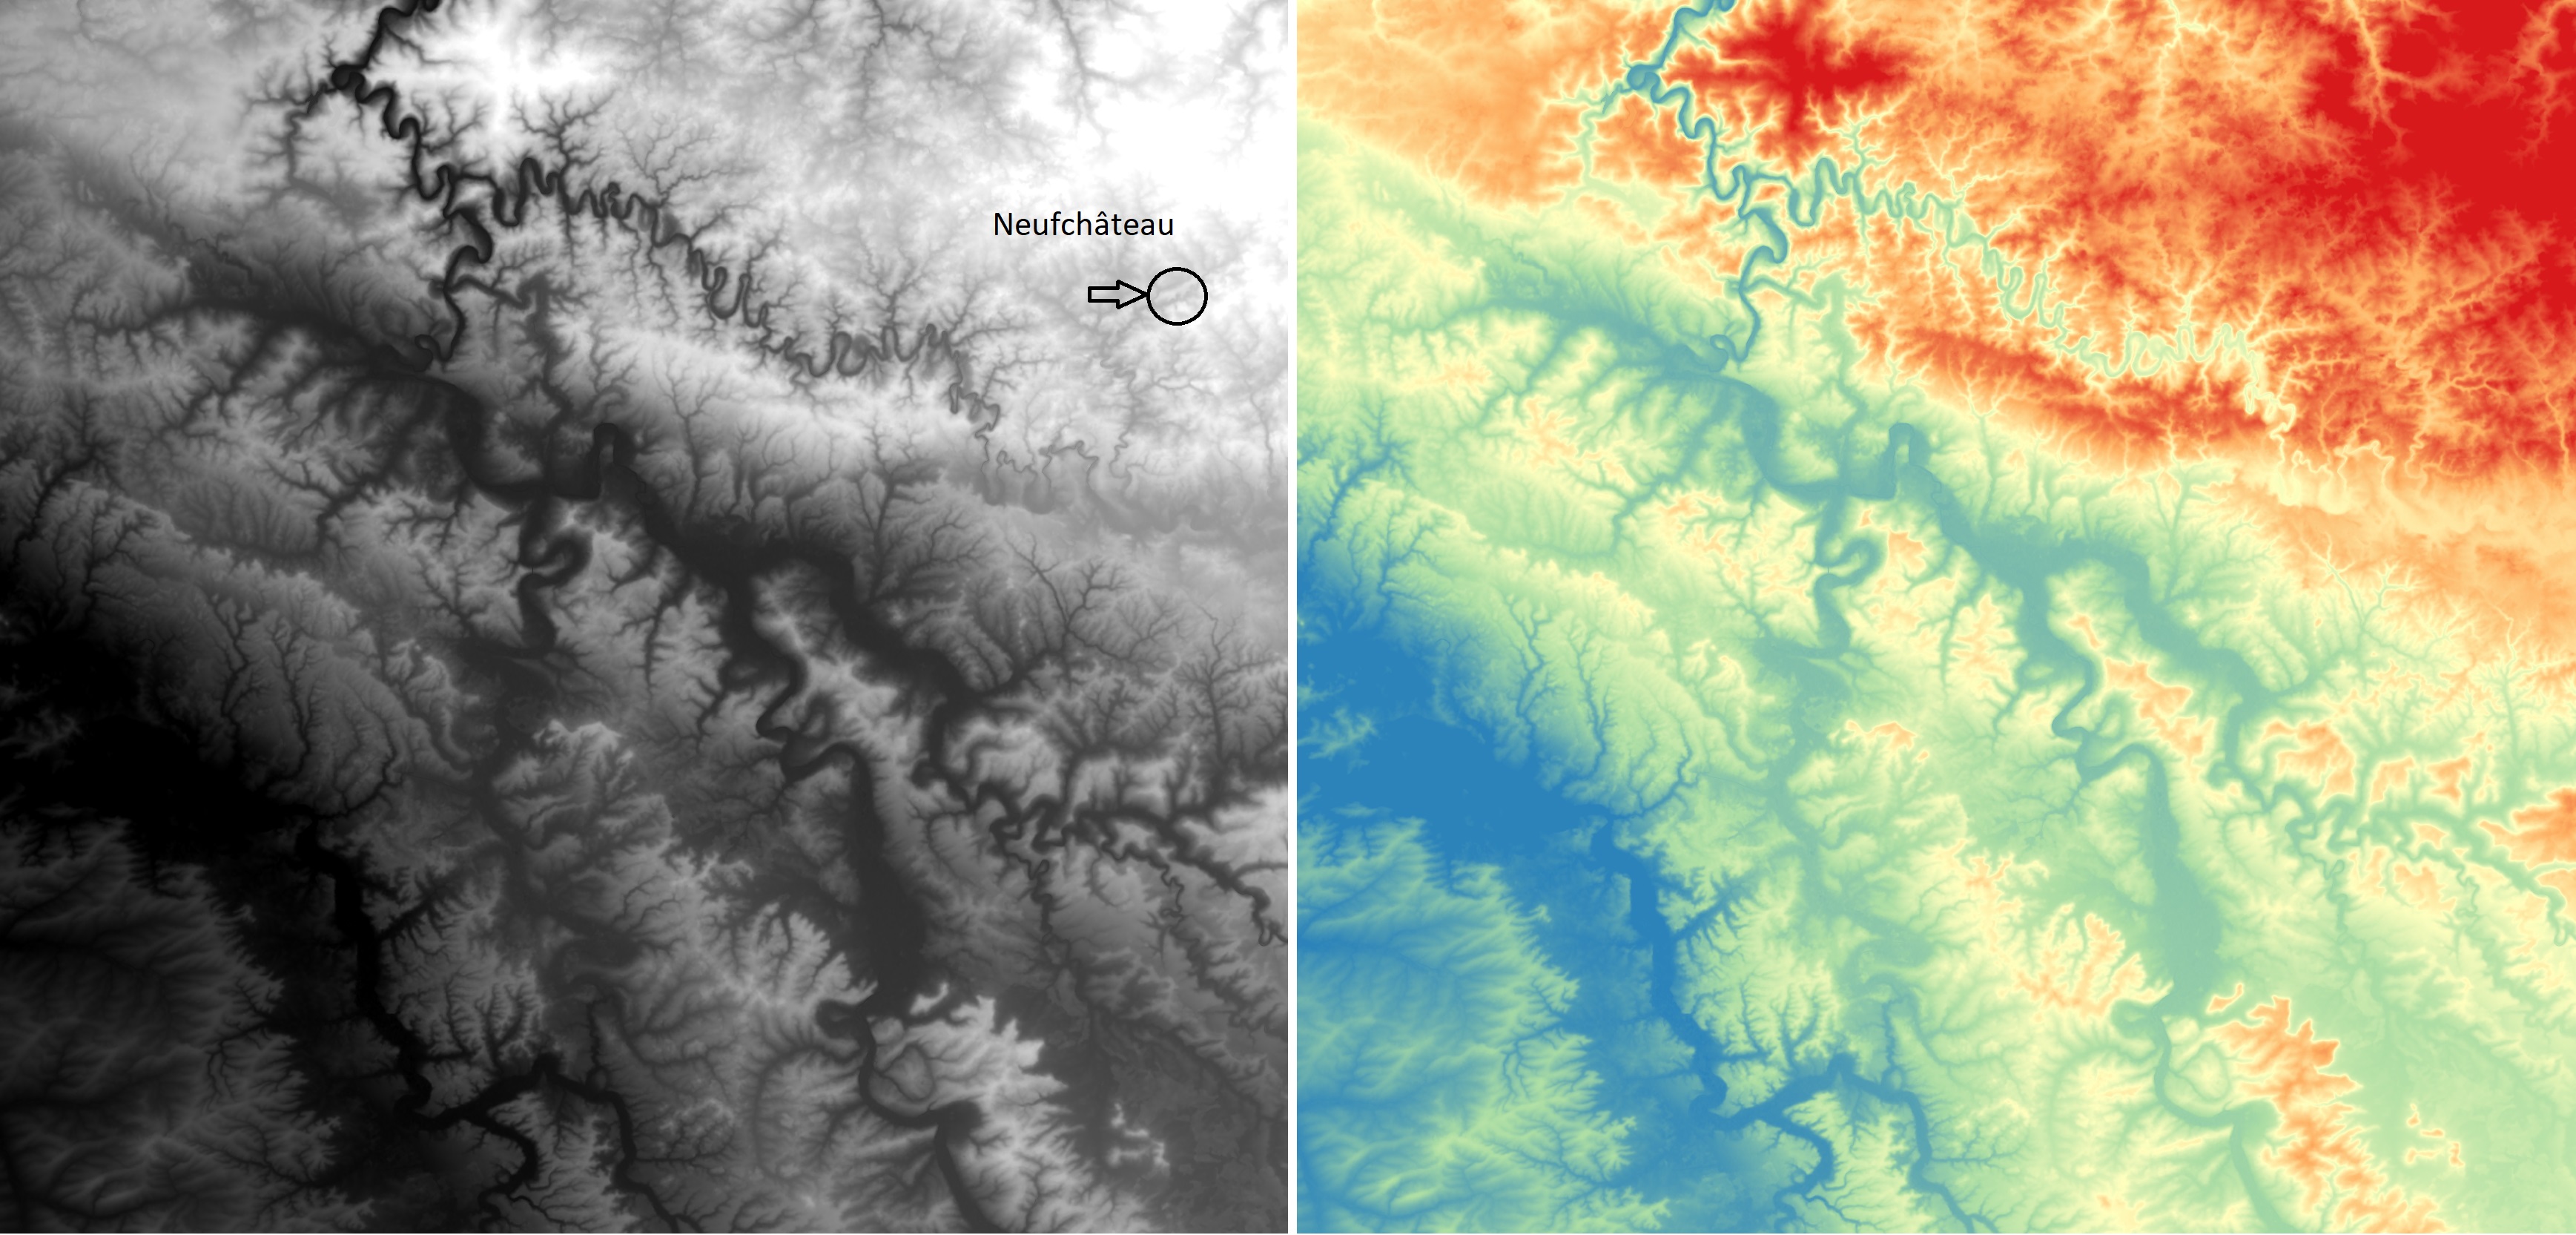 |
| Fig.11 - Copernicus – satellite image - eu_dem_v11_E30N20 Source : https://land.copernicus.eu/ |
On the left, the satellite shot (loops of the Semois clearly visible in the center on the top of the image) and on the right the scale of colors corresponding to the altitude in each point. This satellite image processing is supported by QGIS software licensed from GNU (free at: https://qgis.org/en/site/forusers/download.html). Program very user friendly and easy to use. With this software we can extract the local data for Neufchâteau (colored part on the satellite image) (Fig. 12).
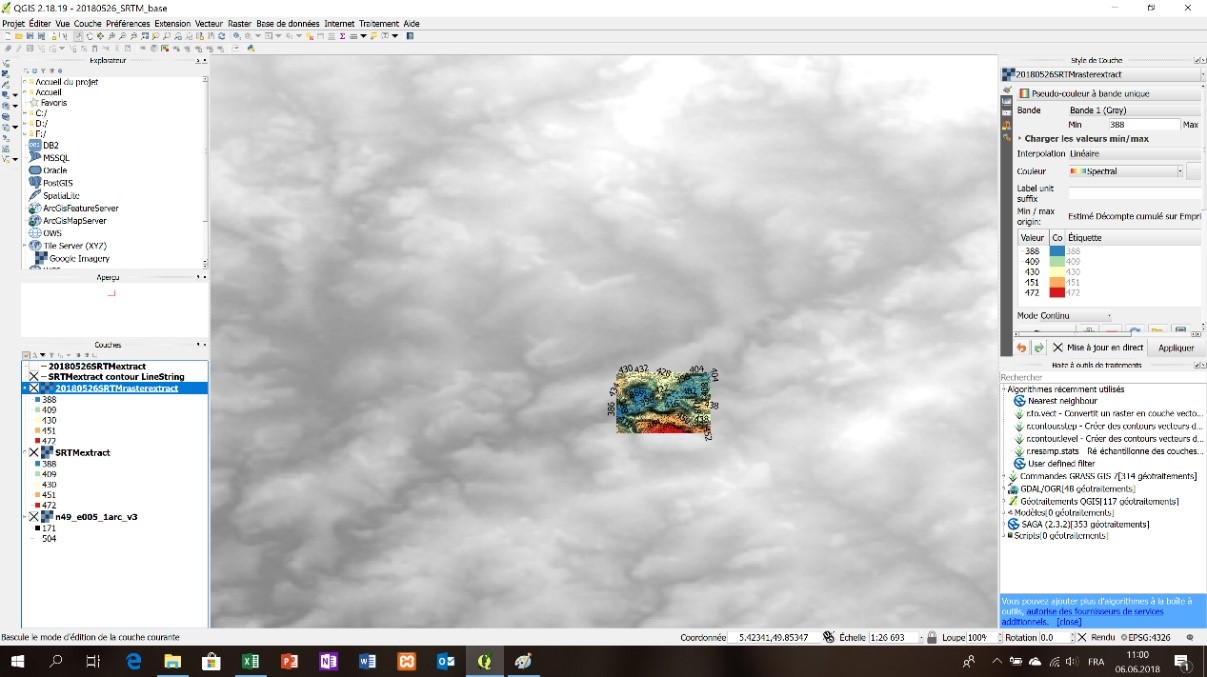 |
| Fig.12 - QGIS software Source : https://qgis.org/en/site/forusers/download.html |
Other US satellite images are available and are very similar. 'SRTM' (Shuttle Radar Topography Mission) files refer to topographic vector and matrix files provided by two US agencies: NASA and NGA (formerly NIMA). These altimetry data were collected during an eleven-day mission in February 2000 by Space Shuttle Endeavor (STS-99) at an altitude of 233 km using radar interferometry. This type of file (4 Gb!) Allows local analysis of the terrain configuration. If we focus on Neufchâteau and its surroundings we get the following results.
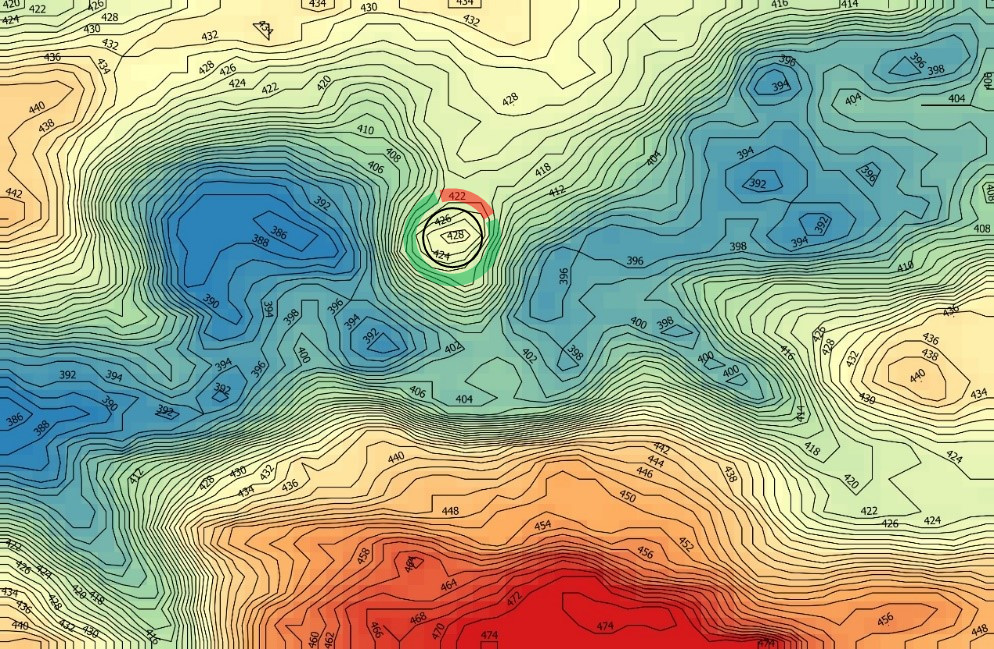 |
| Fig.13 - NASA – satellite image SRTM - n49_e005_1arc_v3 - Neufchâteau Source : https://earthexplorer.usgs.gov/ |
Contours can be extracted with QGIS for later use in the 3D terrain definition. The general appearance highlights a rocky outcrop (center) 425 m above sea level overlooking the valley of the Vierre some 30 m lower. This position is strategic throughout the area. Place where the castle was located. Before the appearance of the artillery, this castle can be threatened by the assailant only on its north face (red outline), the rest being much too steep (green outline) (Fig. 13) . This configuration will have a direct implication on the implantation of the medieval fortress and on its general architecture.
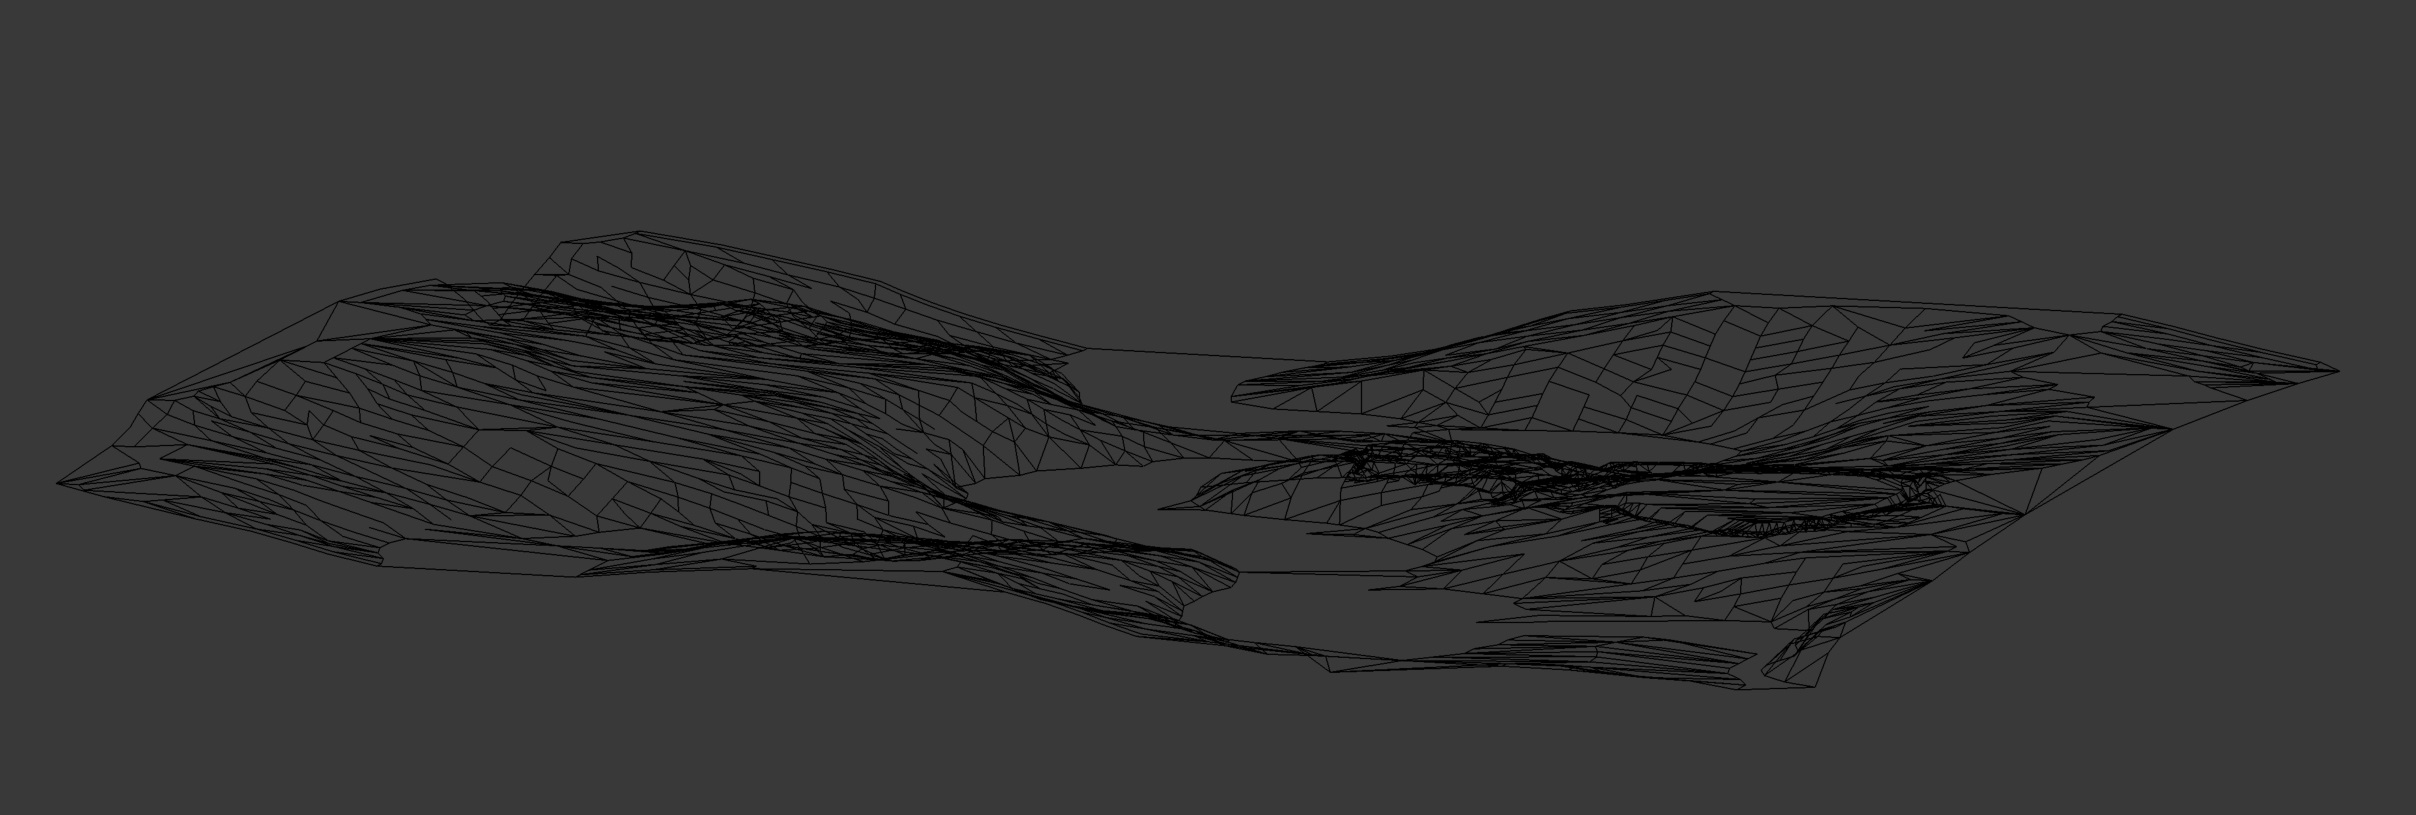
The 'rasters' images provided by the satellites allow direct processing in the form of 'shapes' serving as a basis for immediate triangulation algorithms (Delauney method) with full 3D mesh in a fraction of a second.
The result obtained with Blender (free software for modeling, animation and 3D rendering) is shown in the following figure (Fig. 14) . Our environment is now ready to pose the different elements of the landscape described by the map of Arenberg.
 |
| Fig.14 - Neufchâteau - 3D topographic modeling of the environment Source : Blender model of the author |